Diversity and Inclusion Initiatives
In 2024, the Company had a total of 1,897 employees, comprising 952 men and 945 women, with diversity in age, gender, and education levels ranging from primary school to doctoral degrees. All employees are treated fairly and without discrimination. The Company has expanded its projects to more than 29 provinces nationwide, creating local employment opportunities and encouraging employees to work near their hometowns. Additionally, it promotes the employment of older workers, with 35 employees aged 60 and above, accounting for 1.84% of the total workforce.
In addition, the Company promotes equal employment opportunities for people with disabilities, enabling them to live and work effectively in society. In 2024, the Company participated in the “Inclusion Job Fair 2024” to create employment opportunities between people with disabilities and employers, and has employed a total of 10 people with disabilities (5 men and 5 women). Moreover, the Company continuously supports the improvement of the quality of life for people with disabilities in accordance with the Promotion and Development of Quality of Life of Persons with Disabilities Act, 2007.
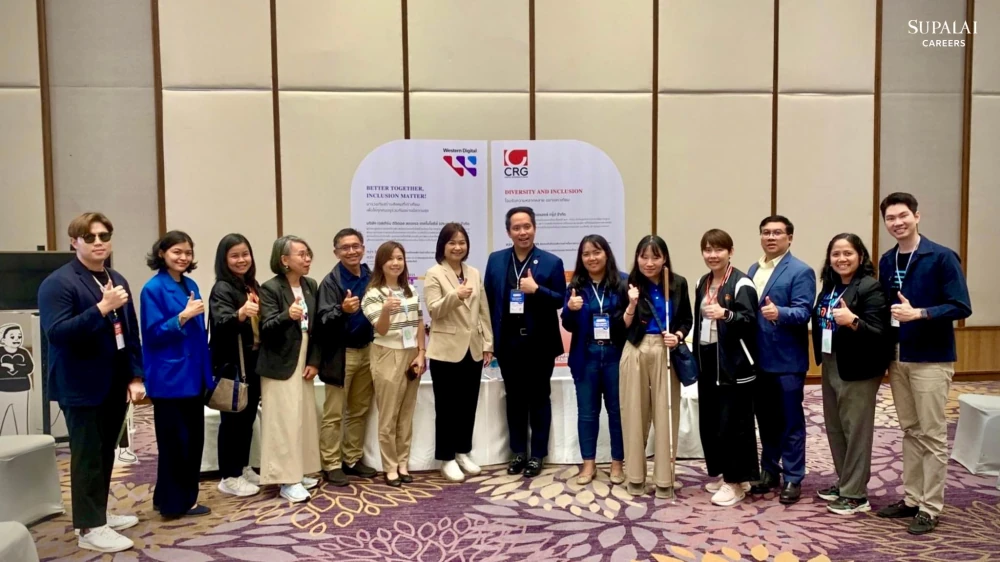
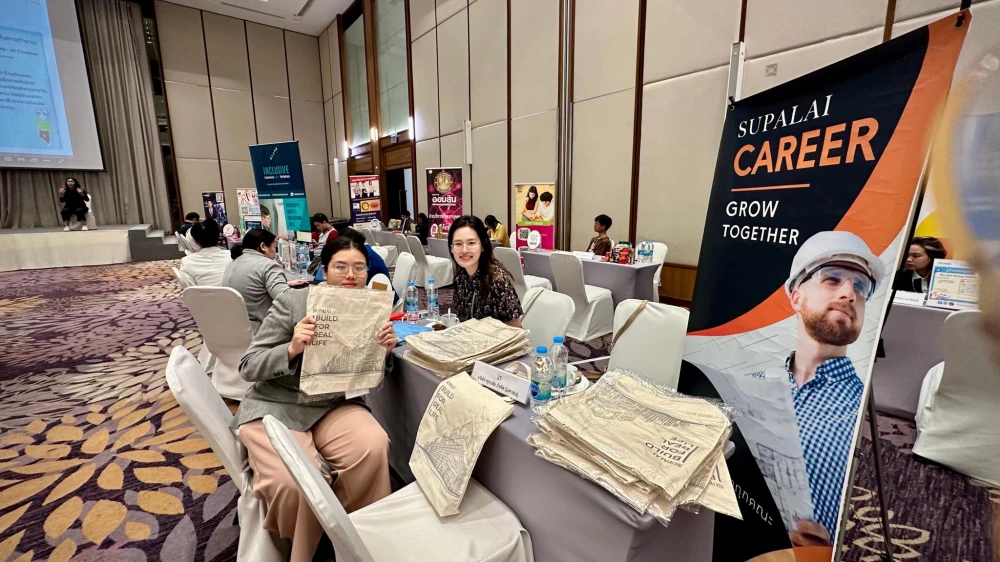
Inclusion Job Fair 2024 - Employment of Persons with Disabiilities
The Company promotes equality through recruitment branding, such as using the Supalai Careers logo and creating equality-focused content on social media. In addition, it offers a voluntary provident fund as a welfare benefit, providing employees with a means of savings and financial security upon retirement.
Promoting equality through Supalai Careers on Facebook
The Company values gender equality, providing opportunities for capable women to advance to executive positions. Currently, out of 11 board members, 4 are women, accounting for more than one-third of all executives.
| Category | Number (People) | Percentage (%) |
|---|---|---|
| Gender Breakdown | ||
| Male | 954 | 50.13 |
| Female | 949 | 49.87 |
| Total | 1,903 | 100.00 |
| Employee Level Breakdown | ||
| Executives and Supervisors | 261 | 13.72 |
| Operational Staff | 1,232 | 64.74 |
| Daily Workers | 410 | 21.54 |
| Age Breakdown | ||
| Under 30 years old | 478 | 25.12 |
| Between 30 years old and above | 1,390 | 73.04 |
| Over 60 years old | 35 | 1.84 |
| Employee Turnover Rate | ||
| Male | 60 | 37.97 |
| Female | 98 | 62.03 |
| Employee Retention by Age Group | ||
| Under 30 years old | 74 | 46.84 |
| Between 30 years old and above | 84 | 53.16 |
| New Employees | ||
| Male | 65 | 31.10 |
| Female | 144 | 68.90 |
| Age of New Employees | ||
| Under 30 years old | 137 | 65.55 |
| Between 30 years old and above | 72 | 34.45 |
| Maternity Leave | ||
| Employees who took maternity leave | 30 | 1.58 |
| Employees with Disabilities | ||
| Male | 5 | 50.00 |
| Female | 5 | 50.00 |